You are here: Panda Wiki>Tagpid Web>ExamplePlots (2006-07-19, KlausFoehl)Edit Attach
Example Plots
SeparationpowerExampleplots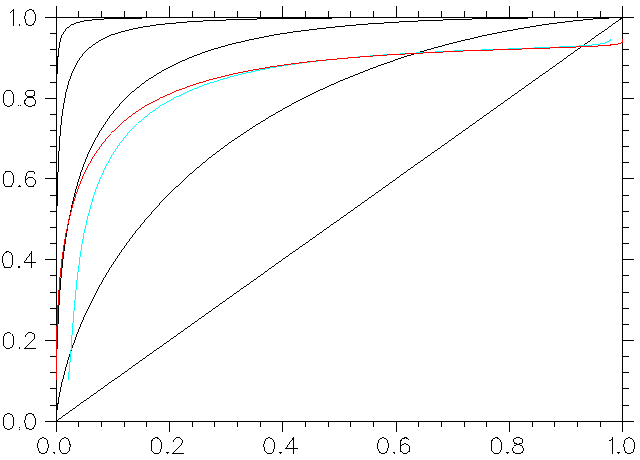
- tagplot1.eps: parameter space
Standalone Endcap DIRC
Analysis (my suggestion) target vertex (theta,phi) as input parameters. Can we neglect phi dependence for our purpose? Plots below show beta and vertex information as derived from disc data only (example of ToP readout here, little mirrors but no multiband).- 6-parameter analysis:
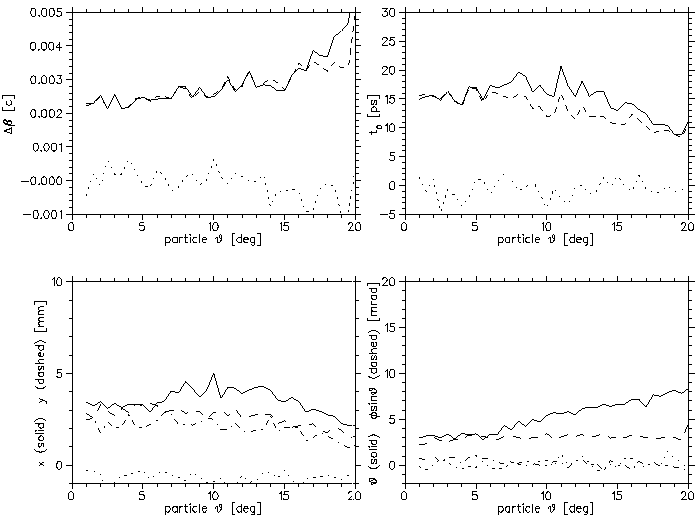
- tagplot3.eps: 6 parameter analysis
- 4 parameter analysis:
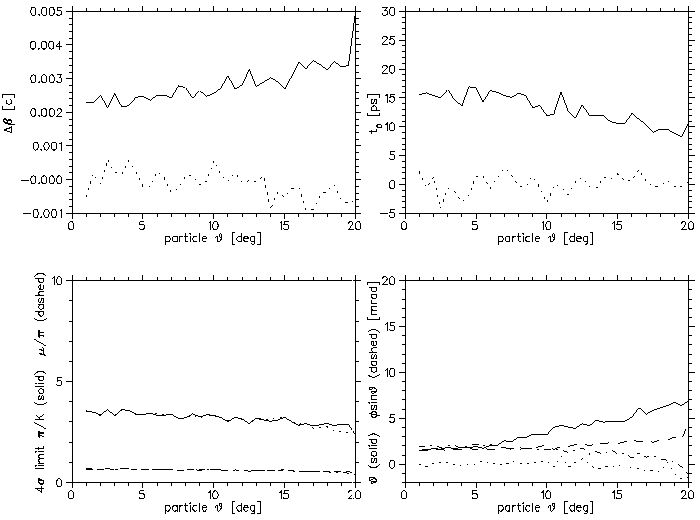
- tagplot4.eps: 4 parameter analysis
Visualisation of Results
Without phi dependence the results can be shown in a singe plot.- sigma lines as function of angle and momentum:
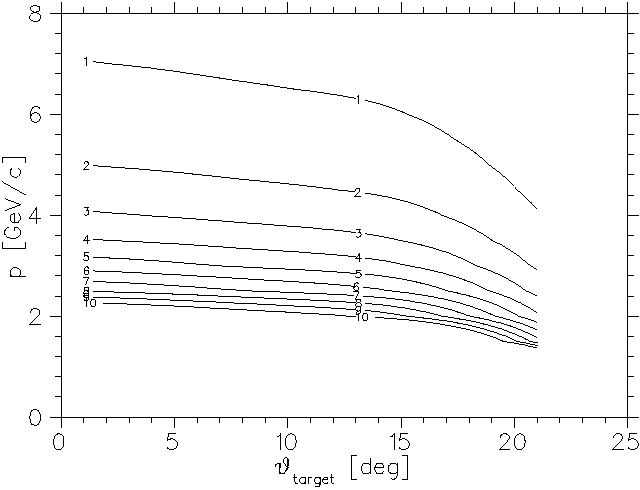
- tagplot2.eps: sigma lines as function of angle and momentum
with phi dependence, no B field
Taking phi dependence into account, one has three input parameters and hence has to create a series of plots. For a given momentum the theta-phi-plots might look like these below (disregard the numbers, they only relate to sigma values).- Example plot without B:
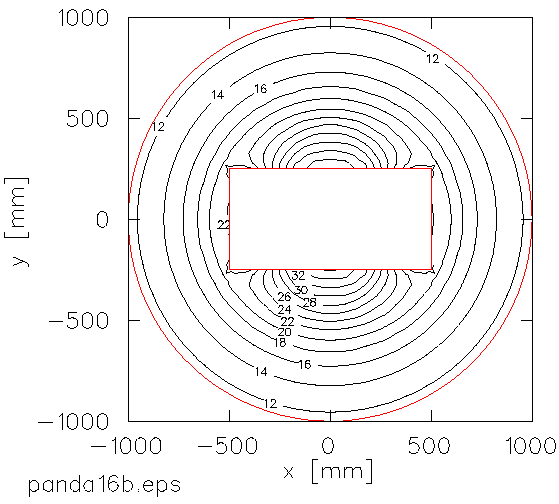
with phi dependence, B field
With magnetic field the gemoetry will be distorted as a function of momentum. One sees that only near the rectangular cutout the rotational symmetry is affected.- Example plot with B :
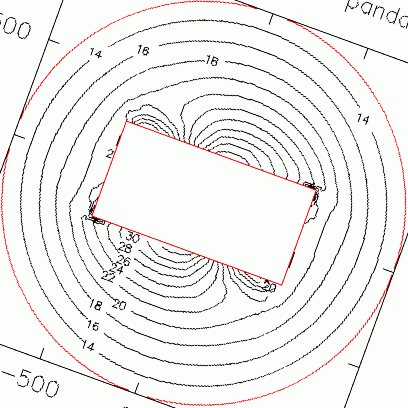
| I | Attachment | Action | Size | Date | Who | Comment |
|---|---|---|---|---|---|---|
| |
panda16b90ccw.gif | manage | 10 K | 2006-07-19 - 12:55 | UnknownUser | template without B |
| |
panda16d70ccw.gif | manage | 28 K | 2006-07-19 - 12:56 | UnknownUser | template with B |
| |
tagplot1.eps | manage | 44 K | 2006-07-19 - 11:52 | UnknownUser | parameter space |
| |
tagplot1.gif | manage | 6 K | 2006-07-19 - 11:51 | UnknownUser | parameter space |
| |
tagplot2.eps | manage | 25 K | 2006-07-19 - 11:53 | UnknownUser | sigma lines as function of angle and momentum |
| |
tagplot2.gif | manage | 6 K | 2006-07-19 - 11:53 | UnknownUser | sigma lines as function of angle and momentum |
| |
tagplot3.eps | manage | 57 K | 2006-07-19 - 12:45 | UnknownUser | 6 parameter analysis |
| |
tagplot3.gif | manage | 9 K | 2006-07-19 - 12:45 | UnknownUser | 6-parameter analysis |
| |
tagplot4.eps | manage | 54 K | 2006-07-19 - 12:45 | UnknownUser | 4 parameter analysis |
| |
tagplot4.gif | manage | 8 K | 2006-07-19 - 12:45 | UnknownUser | 4 parameter analysis |
Edit | Attach | Print version | History: r1 | Backlinks | View wiki text | Edit wiki text | More topic actions
Topic revision: r1 - 2006-07-19, KlausFoehl
Tagpid Web
Web Home | Search Changes | Notifications Index | Topics
Web Home | Search Changes | Notifications Index | Topics
- Webs
- Cerenkov * Cerenkov.Pandacerenkov * DCS * Daq * Daq.Pandadaq * Detector * EMC * EMPAnalysis * Forwardstraws * GEM * MC * Magnet * Main * Mvd * PANDAMainz * PWA * Pbook * Personalpages * Physics * Physics.Baryons * Physics.CharmoniumAndExotics * Physics.HadronsInNuclei * Physics.OpenCharm * PhysicsCmt * SPC * STT * Sandbox * ScrutinyGroup * Tagpid * Tagpid.Pandatagpid * Tagtrk * Tagtrk.Pandatagtrk * Target * Target.ClusterJetTarget * Tof * WebServices * YoungScientists * ZArchives
Create personal sidebar
Copyright © by the contributing authors. All material on this collaboration platform is the property of the contributing authors.
Ideas, requests, problems regarding Panda Wiki Send feedback | Imprint | Privacy Policy (in German)
Ideas, requests, problems regarding Panda Wiki Send feedback | Imprint | Privacy Policy (in German)


