You are here: Panda Wiki>Tagpid Web>MeetingsandWorkshops>PidtagMeeting02>SeparationpowerExampleplot (2006-07-19, KlausFoehl)Edit Attach
Example Plot for Separation Power
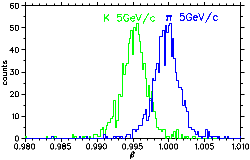 This histogram visualises how distributions in beta look for kaons and pions, the example being a Time-of-Propagation calculation with perspex radiator, 1000 particle in each peak. One can determine the centroid and second moment (peak width in sigma) of these peaks, the ratio distance over sigma then gives a measure for the separation power. Plotting beta is preferred over plotting the reconstructed mass because it does not introduce a singularity at beta=1, the analysis happily giving values beta>1 sometimes.
- This quantity makes sense as long as the peaks are Gaussian in shape.
- This quantity is independent of the acceptance interval choice for pions and/or kaons.
- Such quantities from several subdetectors can be combined.
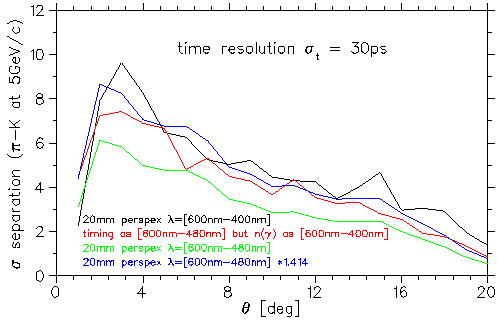
- betasigma30port.eps: separation power expressed in sigma
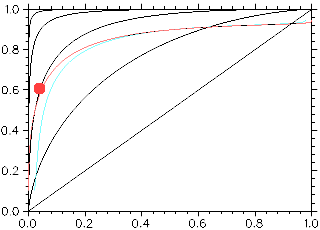
From Sigma to Efficiencies
- curves:
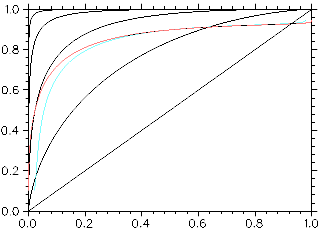
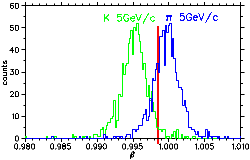
- 2gauss with red line:
- curves with red dot:
| I | Attachment | Action | Size | Date | Who | Comment |
|---|---|---|---|---|---|---|
| |
betasigma30port.eps | manage | 31 K | 2006-06-26 - 16:51 | UnknownUser | separation power expressed in sigma |
| |
betasigma30port.gif | manage | 5 K | 2006-06-26 - 16:55 | UnknownUser | separation power expressed in sigma |
| |
tagplot1.gif | manage | 6 K | 2006-07-19 - 12:24 | UnknownUser | curves |
| |
tagplot1a.gif | manage | 3 K | 2006-07-19 - 12:21 | UnknownUser | curves with red dot |
| |
tagplot1h.gif | manage | 3 K | 2006-07-19 - 12:35 | UnknownUser | curves half size |
| |
visualisation1.gif | manage | 2 K | 2006-06-26 - 17:20 | UnknownUser | distributions for kaons and pions |
| |
visualisation2.gif | manage | 2 K | 2006-07-19 - 12:20 | UnknownUser | 2gauss with red line |
Edit | Attach | Print version | History: r2 < r1 | Backlinks | View wiki text | Edit wiki text | More topic actions
Topic revision: r2 - 2006-07-19, KlausFoehl
Tagpid Web
Web Home | Search Changes | Notifications Index | Topics
Web Home | Search Changes | Notifications Index | Topics
- Webs
- Cerenkov * Cerenkov.Pandacerenkov * DCS * Daq * Daq.Pandadaq * Detector * EMC * EMPAnalysis * Forwardstraws * GEM * MC * Magnet * Main * Mvd * PANDAMainz * PWA * Pbook * Personalpages * Physics * Physics.Baryons * Physics.CharmoniumAndExotics * Physics.HadronsInNuclei * Physics.OpenCharm * PhysicsCmt * SPC * STT * Sandbox * ScrutinyGroup * Tagpid * Tagpid.Pandatagpid * Tagtrk * Tagtrk.Pandatagtrk * Target * Target.ClusterJetTarget * Tof * WebServices * YoungScientists * ZArchives
Create personal sidebar
Copyright © by the contributing authors. All material on this collaboration platform is the property of the contributing authors.
Ideas, requests, problems regarding Panda Wiki Send feedback | Imprint | Privacy Policy (in German)
Ideas, requests, problems regarding Panda Wiki Send feedback | Imprint | Privacy Policy (in German)


