You are here: Panda Wiki>DCS Web>CSSGUIs (2018-01-10, PeterZumbruch)Edit Attach
EPICS GUIs in CSS
- EPICS GUIs in CSS
- Description
- Starting Documentation
- Installing EPICS
- Installing Control System Studio
- An Introduction to Control System Studio (CSS)
- Simplest toy system
- Using a st.cmd file
- Simple example of a sender script and a strip chart
- Example involving a CALC variable
- Example with two charts, and one channel controlled via the GUI
- Example of a popup dialog
- Dipole Magnet GUI
Description
This tutorial teaches you how to use CSS (Control System Studio) to write GUIs that communicate with the EPICS slow controls system of PANDA. No previous knowledge of EPICS or CSS is required, since we start from scratch with EPICS installation and first steps, CSS installation and project set up, and we use existing information from the DCS requirements database.Starting Documentation
Some direct links to resources used herein:- EPICS (GSI wiki)
- CSS (Control System Studio)
- PANDA DCS wiki | eLog
Installing EPICS
First EPICS base:- Download source from https://epics.anl.gov/download/base/index.php (baseR3.14.11.tar.gz)
- Unpack with
tar -zxvf baseR3.14.11.tar.gz - Set
export EPICS_HOST_ARCH=linux-x86_64(or whatever your architecture actually is) - Go into
configure/directory; domake - Go to
../src; domake
~/.bashrc for example:
# Set the proper environment for EPICS
case `uname -sp` in
    "Linux i386" | "Linux i486" | "Linux i586" | "Linux i686")
        export EPICS_HOST_ARCH=linux-x86
        ;;
    "Linux x86_64")
        export EPICS_HOST_ARCH=linux-x86_64
        ;;
    *)
        echo "Unsupported architecture : `uname -sp`"
        exit 1
        ;;
esac
export EPICS_BASE=/home/epics/EPICS/base-3-14-11
export PATH=${PATH}:$EPICS_BASE/bin/$EPICS_HOST_ARCH
Installing Control System Studio
- Download (latest) package from http://css.desy.de/content/e413/index_eng.html
- Unzip with
unzip css_1.2.0_LinuxGTK.zip - Navigate to the css subdirectory in the extracted folder and find a file called css (Note: not the css.ini file)
- Allow this file to be run as executable
- Execute this file to launch css:
./css
An Introduction to Control System Studio (CSS)
CSS is a Java interface that uses Synoptic Display Studio (SDS) for creating GUIs to interact with scientific instruments using EPICS. It operates around the concept of widgets; icons that are used to display input and adjust output. these icons come in the form of buttons, meters, labels etc. These widgets have numerous properties that can be changed to suit your needs. These properties are divided up into 4 categories. Position, display, border and behaviour.- The position properties are used for adjusting the size of the widget and its position on the display
- The display properties are used to adjust what information the icon displays and how it is displayed. For example an icon turning red when the temperature goes too high.
- The border properties are used for adjusting the style of border on the widget.
- The behaviour properties can be used to adjust the data being taken in and various warning levels
- Open a Display Development window. To do this go to file-new-other and select the "Synoptic Display" option and click next. Select the folder you want to save the file in and a file name and click finish.
- In the CSS window navigate to where you saved the file and double-click on it. A blank Display Development frame should now open.
- To add objects to the Display Development you should click on the object on the Palette and then click and drag the mouse in the Display Development to choose the size of the object.
- To edit the properties of this object you must use the Widget Properties window.
- To set a dynamic variable (i.e. use an EPICS variable) right click on the field (note: fields with a cogs icon beside them can be set dynamically) and select "configure dynamic aspect". A new window will open and under the "channel" heading type the name of the EPICS variable you want to use and then select the type as EPICS.
Simplest toy system
Setting up an EPICS db: create a file, saypaul.db containing:
record(ai, "v1"){
        field(DESC, "Value 1")
        field(PREC, "3")
}

record(calc, "paul"){
        field(PREC, "3")
}
Start a soft IOC with
softIoc -s -m user=$USER -d paul.dband you are now in
epics> prompt, but from another terminal on the same machine, one is able to manipulate this channel with caget and caput:
[pmullen@npc27 ~]$ caget v1
v1                             0
[pmullen@npc27 ~]$ caput v1 33
Old : v1                             0
New : v1                             33
[pmullen@npc27 ~]$ caget v1
v1                             33
and for the CALC type variable
paul
[pmullen@npc27 ~]$ cainfo paul
paul
    State:            connected
    Host:             130.209.45.14:5064
    Access:           read, write
    Native data type: DBF_DOUBLE
    Request type:     DBR_DOUBLE
    Element count:    1
[pmullen@npc27 ~]$ caput paul.A 2
Old : paul.A                         0
New : paul.A                         2
[pmullen@npc27 ~]$ caput paul.B 5
Old : paul.B                         0
New : paul.B                         5
[pmullen@npc27 ~]$ caput paul.CALC "A+B"
Old : paul.CALC                      0
New : paul.CALC                      A+B
[pmullen@npc27 ~]$ caget paul
paul                           7
Using a st.cmd file
Another way to start the softIoc is to create a file called st.cmd containing commands like
$EPICS_BASE/bin/$EPICS_HOST_ARCH/caRepeater 2>&1 >/dev/null &
dbLoadRecords("~/EPICS/paul.db")
iocInit
and then type
[pmullen@npc27 ~]$ softIoc st.cmdThis starts
caRepeater (the path to this file may be different on your system), loads an EPICS database and launches iocInit.
Simple example of a sender script and a strip chart
We run a shell script that periodically modifies the value of an EPICS variablev1:
#!/bin/bash

for (( c=1; c<=3600; c++ ))
do
  echo "Setting v1 to $c"
  d=`echo "s(6.28*$c/300)" | bc -l`
  caput v1 $d
  sleep 1
done
This runs on a computer on the NPE subnet (130.209.45.0/24). On another computer connected to the same subnet, we have a CSS GUI that plots a time history of
v1. Here is a snapshot of this simple GUI:
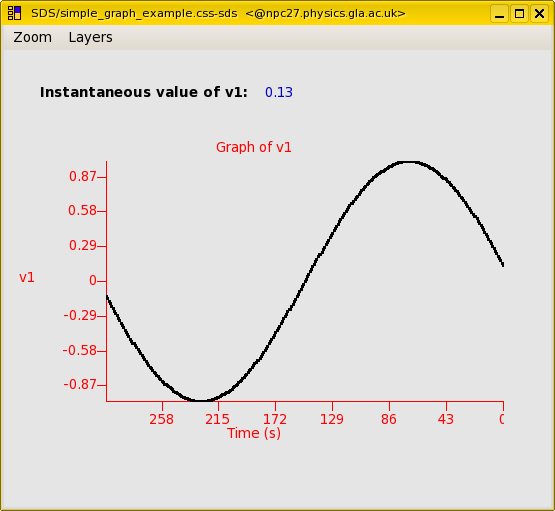 and here is the source code. To run this example on your computer do the following:
 - Start the
softIocas shown above - Download and start the sender script
- Start CSS and load the css-sds source (File -> Open File ...)
- Press
CTRL+R
Example involving a CALC variable
A typeCALC channel is used for a Celsius to Fahrenheit conversion in this simple example. Here is the GUI. To get a temperature in Fahrenheit just enter the temperature in Celsius in the input box and the converted temperature will appear in the second box:
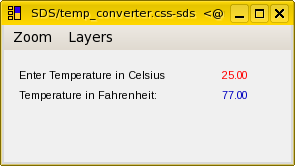 Here are the source code and the database file used.
Example with two charts, and one channel controlled via the GUI
We have a sender (myscriptfreq.sh) that retrieves the value oft1 from the EPICS environment and uses it in a formula
v1 = sin(6.28*x/t1)where
x is incremented by a loop and t1 can be set using the slider in the GUI. This allows the user to vary the frequency of the sin curve generated as shown below
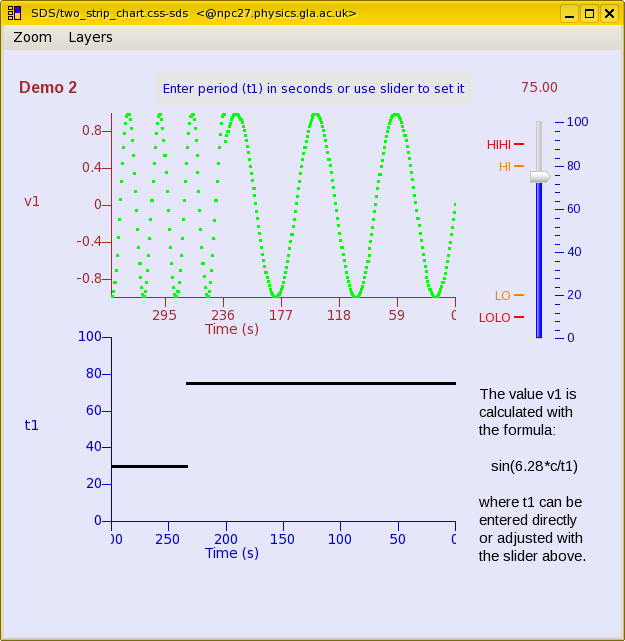 Here are the SDS source code and the accompanying database file.
Example of a popup dialog
We have the same database and script as in the the two chart example above. However, this time the GUI is set up so that a button on the main GUI opens a dialog from which we can control the period of the sine curve. A screenshot of the main window is shown below: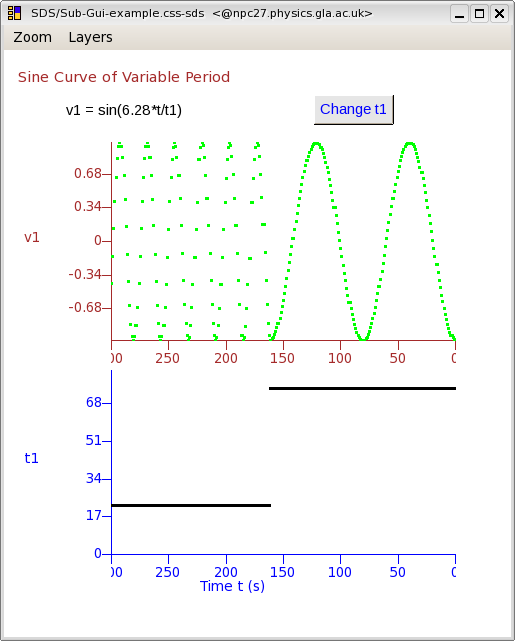 and the a screenshot of the dialog controlling the period is shown here:
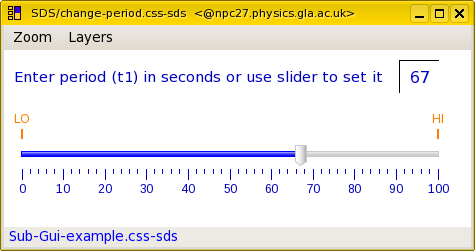 Here is the code for the main window and the popup window.
Dipole Magnet GUI
Using the information from the DCS_REQ database, we wrote the GUI for the Dipole Magnet subsystem: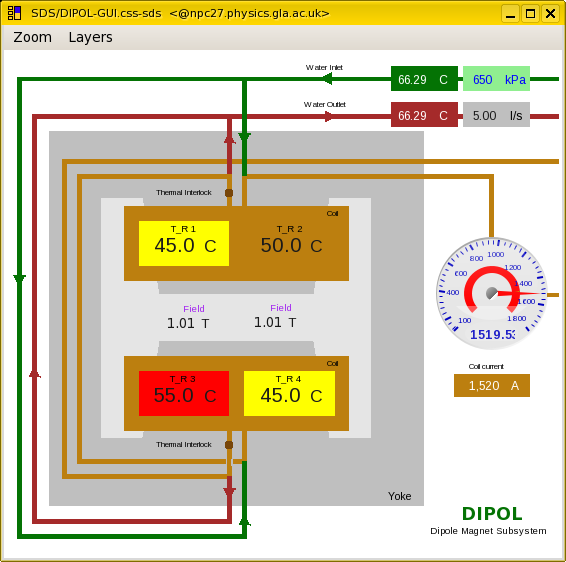 This is documented in a separate wiki - DipolGUI.
-- PaulMullen & DanProtopopescu - 22 Jun 2010
imported from http://nuclear.gla.ac.uk/twiki/bin/view.pl/Main/CSSGUIs?raw=on
-- PeterZumbruch - 23 Aug 2012
 | I | Attachment | Action | Size | Date | Who | Comment |
|---|---|---|---|---|---|---|
| |
DIPOL-GUI-mini.png | manage | 38 K | 2012-08-23 - 14:00 | PeterZumbruch | DIPOL GUI screenshot |
| |
Screenshot-paul-widg-test-Sub-Gui-example.css-sds_-1.png | manage | 26 K | 2012-08-23 - 14:01 | PeterZumbruch | GUI with popup dialog example - main window |
| |
Screenshot-paul-widg-test-change-period.css-sds_-1.png | manage | 16 K | 2012-08-23 - 14:01 | PeterZumbruch | GUI with popup dialog example - popup window |
| |
Screenshot-paul-widg-test-simple_graph_example.css-sds2_.png | manage | 23 K | 2012-08-23 - 14:01 | PeterZumbruch | Screenshot (simple example with one EPICS channel) |
| |
Screenshot-paul-widg-test-temp_converter.css-sds_-2.png | manage | 9 K | 2012-08-23 - 14:01 | PeterZumbruch | Screenshot of the temperature converter example |
| |
Screenshot-paul-widg-test-two_strip_chart.css-sds_-1.png | manage | 42 K | 2012-08-23 - 14:02 | PeterZumbruch | Screenshot of two chart variable frequency example |
| |
Sub-Gui-example.css-sds | manage | 27 K | 2012-08-23 - 14:03 | PeterZumbruch | GUI with popup dialog example - main window source code |
| |
change-period.css-sds | manage | 16 K | 2012-08-23 - 14:03 | PeterZumbruch | Source code for multiple window example - second window |
| |
myscript.sh | manage | 135 bytes | 2012-08-23 - 14:03 | PeterZumbruch | Script to modify the value of EPICS channel v1 |
| |
myscriptfreq.sh | manage | 239 bytes | 2012-08-23 - 14:04 | PeterZumbruch | Script to create sin curve with variable period |
| |
simple_graph_example.css-sds | manage | 23 K | 2012-08-23 - 14:04 | PeterZumbruch | Source code (example with one EPICS channel) |
| |
temp.db | manage | 112 bytes | 2012-08-23 - 14:04 | PeterZumbruch | Database for Temperature Conversion |
| |
temp_converter.css-sds | manage | 18 K | 2012-08-23 - 14:05 | PeterZumbruch | Source code for temperature converter GUI |
| |
two_strip_chart.css-sds | manage | 38 K | 2012-08-23 - 14:05 | PeterZumbruch | Source code for variable period example |
| |
varfreq.db | manage | 138 bytes | 2012-08-23 - 14:05 | PeterZumbruch | Database for variable period example |
Edit | Attach | Print version | History: r2 < r1 | Backlinks | View wiki text | Edit wiki text | More topic actions
Topic revision: r2 - 2018-01-10, PeterZumbruch
DCS Web
Web Home | Search Changes | Notifications Index | Topics
Web Home | Search Changes | Notifications Index | Topics
- Webs
- Cerenkov * Cerenkov.Pandacerenkov * DCS * Daq * Daq.Pandadaq * Detector * EMC * EMPAnalysis * Forwardstraws * GEM * MC * Magnet * Main * Mvd * PANDAMainz * PWA * Pbook * Personalpages * Physics * Physics.Baryons * Physics.CharmoniumAndExotics * Physics.HadronsInNuclei * Physics.OpenCharm * PhysicsCmt * SPC * STT * Sandbox * ScrutinyGroup * Tagpid * Tagpid.Pandatagpid * Tagtrk * Tagtrk.Pandatagtrk * Target * Target.ClusterJetTarget * Tof * WebServices * YoungScientists * ZArchives
Create personal sidebar
Copyright © by the contributing authors. All material on this collaboration platform is the property of the contributing authors.
Ideas, requests, problems regarding Panda Wiki Send feedback | Imprint | Privacy Policy (in German)
Ideas, requests, problems regarding Panda Wiki Send feedback | Imprint | Privacy Policy (in German)


