Directed Graph Plugin Examples
Howto
HowtoDirectedGraphs has a basic howto on creating directed graphs using dot.
The below examples show some of the capabilities of the
DirectedGraphPlugin
Examples
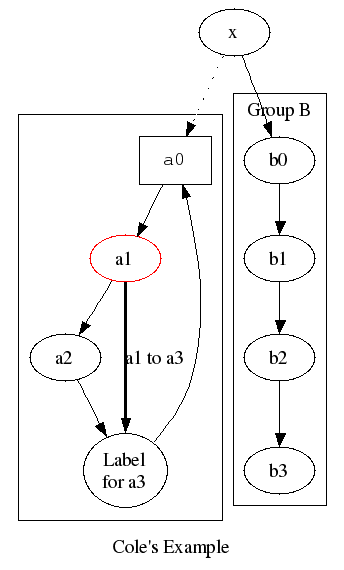
Cole's example
You type:
<dot >
digraph G {
    subgraph cluster_c0 {a0 -> a1 -> a2 -> a3}
    subgraph cluster_c1 {
        b0 -> b1 -> b2 -> b3;
        label="Group B";
    }
    x -> a0 [style=dotted];
    x -> b0;
    a1 -> a3 [style=bold, label="a1 to a3"];
    a3 -> a0;
    a0 [shape=box, fontname=Courier, fontsize=11];
    a1 [color=red];
    a3 [label="Label\nfor a3"];
    label="Cole's Example";
}
</dot>
You get: (simulated)
|
You get: (if installed)
digraph G {
subgraph cluster_c0 {a0 -> a1 -> a2 -> a3}
subgraph cluster_c1 {
b0 -> b1 -> b2 -> b3;
label="Group B";
}
x -> a0 [style=dotted];
x -> b0;
a1 -> a3 [style=bold, label="a1 to a3"];
a3 -> a0;
a0 [shape=box, fontname=Courier, fontsize=11];
a1 [color=red];
a3 [label="Label\nfor a3"];
label="Cole's Example";
}
|
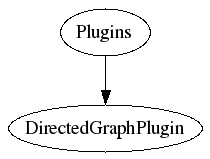
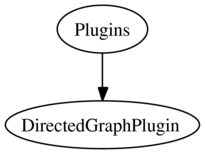
Clientside imagemap (clickable nodes and edges)
You type:
<dot map="1" size="auto" antialias="on">
digraph G {
    URL="http://foswiki.org";
    Plugins [URL="http://foswiki.org/Extensions"];
    DirectedGraphPlugin [URL="http://foswiki.org/Extensions/DirectedGraphPlugin"];
    Plugins -> DirectedGraphPlugin;
}
</dot>
You get: (simulated)
|
You get: (if installed)
digraph G {
URL="http://www.foswiki.org";
Plugins [URL="http://foswiki.org/Extensions/PluginPackage"];
DirectedGraphPlugin [URL="http://foswiki.org/Extensions/DirectedGraphPlugin"];
Plugins -> DirectedGraphPlugin;
}
|
You get: (simulated, antialiasing on)
|
You get: (if installed, antialiasing on)
digraph G {
URL="http://www.foswiki.org";
Plugins [URL="http://foswiki.org/Extensions/PluginPackage"];
DirectedGraphPlugin [URL="http://foswiki.org/Extensions/DirectedGraphPlugin"];
Plugins -> DirectedGraphPlugin;
}
|
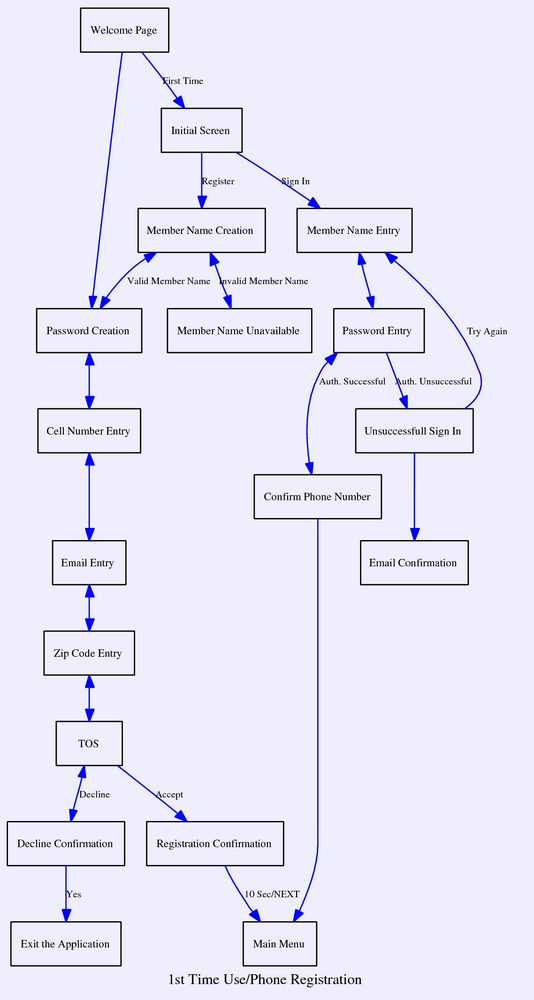
Usecase description / state diagram
To view the
dot input for this example, click the
[dot] link located below the diagram.
You get: (simulated)
|
You get: (if installed)
digraph G {
size="9";
graph [rankdir="TB" label="1st Time Use/Phone Registration" fontsize=12 bgcolor="#eeeeff"];
node [shape=box fontsize=9];
edge [color=blue fontsize=8 font="Arial"];
cell_number_entry [label="Cell Number Entry"];
welcome [label="Welcome Page"];
member_name_creation [label="Member Name Creation"];
password_creation [label="Password Creation"];
member_name_unavailable [label="Member Name Unavailable"];
email_entry [label="Email Entry"];
zip_code_entry [label="Zip Code Entry"];
tos [label="TOS"];
decline_confirmation [label="Decline Confirmation"];
registration_confirmation [label="Registration Confirmation"];
member_name_entry [label="Member Name Entry"];
password_entry [label="Password Entry"];
confirm_phone_number [label="Confirm Phone Number"];
unsuccessfull_sign_in [label="Unsuccessfull Sign In"];
email_confirmation [label="Email Confirmation"];
main_menu [label="Main Menu"];
initial_screen [label="Initial Screen"];
exit_application [label="Exit the Application"];
welcome -> initial_screen [label="First Time"]
initial_screen -> member_name_creation [label="Register"];
initial_screen -> member_name_entry [label="Sign In"];
member_name_creation -> password_creation [label="Valid Member Name" dir="both"];
member_name_creation -> member_name_unavailable [label="Invalid Member Name" dir="both"];
welcome -> password_creation;
password_creation -> cell_number_entry [dir="both"];
member_name_entry -> password_entry [dir="both"];
cell_number_entry -> email_entry [dir="both"];
password_entry -> confirm_phone_number [label="Auth. Successful" dir="both"];
password_entry -> unsuccessfull_sign_in [label="Auth. Unsuccessful"];
email_entry -> zip_code_entry [dir="both"];
zip_code_entry -> tos [dir="both"];
confirm_phone_number -> main_menu;
unsuccessfull_sign_in -> member_name_entry [label="Try Again" constraint="false"];
unsuccessfull_sign_in -> email_confirmation;
tos -> decline_confirmation [label="Decline" dir="both"];
tos -> registration_confirmation [label="Accept"];
decline_confirmation -> exit_application [label="Yes"];
registration_confirmation -> main_menu [label="10 Sec/NEXT"];
}
|
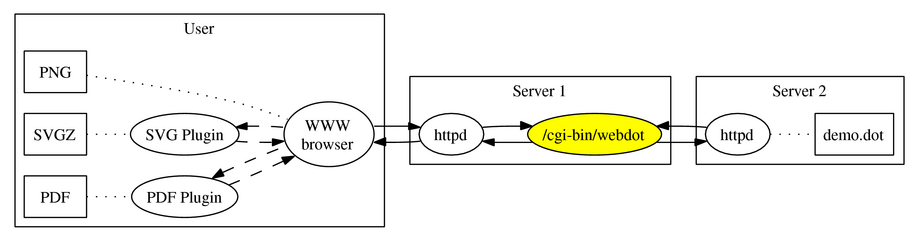
Component architecture (inline SVG)
This is a typical example of a component architecture drawing (This kind of graph is also easy to do in
Foswiki:Extensions.JHotDrawPlugin if you like the look but you prefer to draw it manually using your mouse).
Click the
[dot] link located below the diagram to view the input. Note that this example is an inline
SVG with fallback to
PNG
You get: (simulated)
|
You get: (if installed)
digraph G {
graph [rankdir=LR, size="9.5,2.5"]
subgraph cluster_0 {
graph [label=User]
edge [style=dashed]
browser [label="WWW\nbrowser" URL="http://www.mozilla.org/"]
svgplugin [label="SVG Plugin" URL="http://www.adobe.com/svg/viewer/install/old.html"]
pdfplugin [label="PDF Plugin" URL="http://www.adobe.com/support/downloads/product.jsp?product=10&platform=unix"]
svgplugin -> browser
svgplugin -> browser [dir=back]
pdfplugin -> browser
pdfplugin -> browser [dir=back]
{
graph [rank=same]
pngpage [label=PNG shape=box URL="/webdot/webdot/demo.dot.dot.png"]
svgpage [label=SVGZ shape=box URL="/webdot/webdot/demo.dot.dot.svgz"]
pdfpage [label=PDF shape=box URL="/webdot/webdot/demo.dot.dot.pdf"]
}
pngpage -> browser [dir=none style=dotted]
svgpage -> svgplugin [dir=none style=dotted]
pdfpage -> pdfplugin [dir=none style=dotted]
}
subgraph cluster_1 {
graph [label="Server 1"]
httpd1 [label=httpd URL="http://httpd.apache.org/"]
webdot [label="/cgi-bin/webdot" style=filled fillcolor=yellow color=black URL="/webdot/"]
}
subgraph cluster_2 {
graph [label="Server 2"]
httpd2 [label=httpd URL="http://httpd.apache.org/"]
"demo.dot" [shape=box URL="/webdot/demo.dot"]
httpd2 -> "demo.dot" [dir=none style=dotted]
}
browser -> httpd1 -> webdot -> httpd2
browser -> httpd1 -> webdot -> httpd2 [dir=back]
}
|
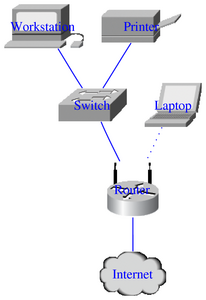
Simple LAN setup (custom icons / shapefiles)
This type of graph can also easily be extended, for instance making network nodes clickable, pointing to asset databases or similar.
Click the
[dot] link below the diagram to view the input.
You get: (simulated)
|
You get: (if installed)
digraph G { size="2,3!"; dpi="100";
edge [arrowhead=none color=blue];
node [fontcolor=blue color=white];
Workstation [shapefile="Sun_Workstation.png"];
Printer [shapefile="Printer.png"];
Internet [shapefile="Cloud-Filled.png"];
Router [shapefile="Wireless_Router.png"];
Switch [shapefile="Workgroup_Switch.png"];
Laptop [shapefile="Laptop.png"];
Workstation -> Switch;
Printer -> Switch;
Switch -> Router;
Router -> Internet;
Laptop -> Router [style=dotted];
}
|
You get: (if installed, antialiased)
digraph G { size="2,3!"; dpi="100";
edge [arrowhead=none color=blue];
node [fontcolor=blue color=white];
Workstation [shapefile="Sun_Workstation.jpg"];
Printer [shapefile="Printer.jpg"];
Internet [shapefile="Cloud-Filled.jpg"];
Router [shapefile="Wireless_Router.jpg"];
Switch [shapefile="Workgroup_Switch.jpg"];
Laptop [shapefile="Laptop.jpg"];
Workstation -> Switch;
Printer -> Switch;
Switch -> Router;
Router -> Internet;
Laptop -> Router [style=dotted];
}
|
Related Topics:
HowtoDirectedGraphs